


What Google Search Console Actually Shows You About Your Site’s Traffic Ceiling
A site owner checks their Google Analytics dashboard, sees a flat traffic line for three months, and decides the site is dead. They walk away. Meanwhile, Google Search Console was sitting right there, showing them seventeen hundred keywords sitting in positions eleven through twenty — one page of optimization away from doubling their clicks. That’s not a hypothetical. That pattern shows up across content sites constantly.

Most people treat Google Search Console like a report card. They glance at the total clicks, nod or frown, and close the tab. That’s the wrong move. GSC is not a report card. It’s a map of your site’s traffic ceiling — and more importantly, it shows you exactly where the ceiling is cracked and ready to break open. This guide walks you through how to read that map and turn it into a concrete growth plan.
Why GSC Data Hits Different Than Analytics
Google Analytics tells you what happened after someone landed on your site. Google Search Console tells you what happened before the click — what people searched, where your pages ranked, and how often Google showed your content versus how often someone actually clicked through. That pre-click data is where your real leverage lives.
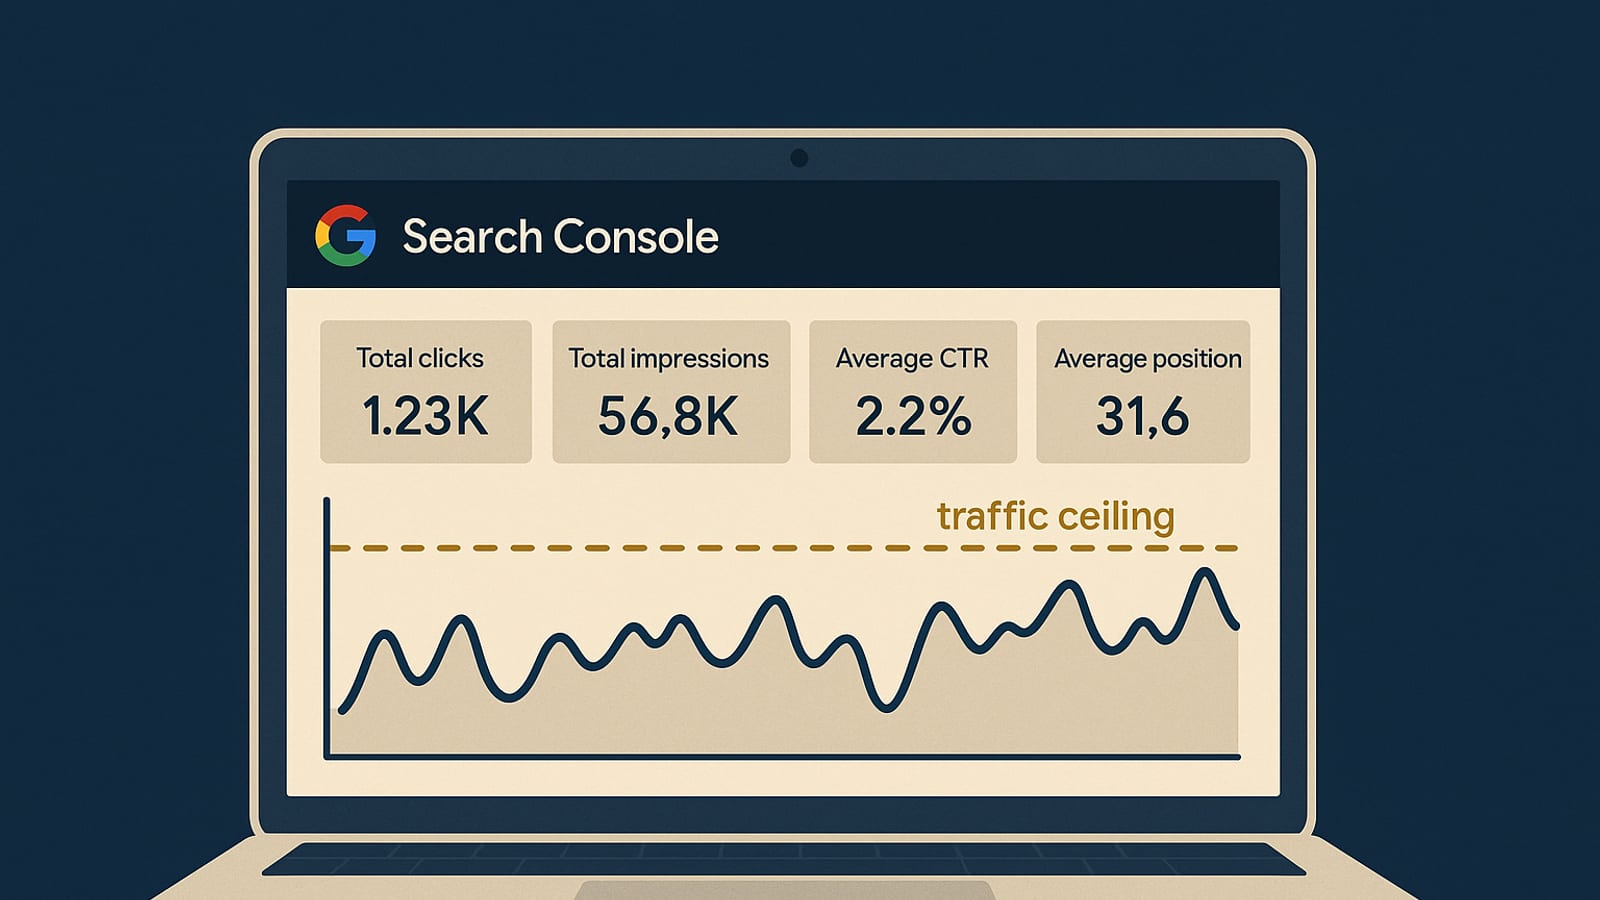
The core metrics in GSC are four: Total Clicks, Total Impressions, Average CTR, and Average Position. Clicks and impressions you probably know. But the relationship between impressions and CTR is where most site owners leave traffic on the table.
Here’s the mechanic: if a page has ten thousand impressions per month and a two percent CTR, it’s pulling two hundred clicks. Move that CTR to five percent — which is realistic for a position-three result — and you’re at five hundred clicks from the exact same Google real estate. No new content. No new links. Just a better title tag and meta description. That’s a system optimization, not a content sprint.
The Traffic Ceiling Is Hidden in Your Impressions Report
Open GSC. Go to Search Results. Set your date range to the last three months. Now sort by Impressions, not clicks. What you’re looking at is the full size of your audience — everyone Google showed your pages to, whether they clicked or not.
A page with fifty thousand impressions and a one percent CTR is a five-hundred-click page that should be a two-thousand-click page. That gap — from one percent to four percent CTR — is your traffic ceiling. It’s not theoretical ceiling. It’s a real number sitting in your data right now.
The most valuable segment to pull is what practitioners call the “page two trap” — keywords where your average position is between eleven and twenty. These are pages Google has already decided are relevant. They’re just not on page one yet. A targeted internal linking push or a content depth update can move a position-fourteen result to position seven in sixty to ninety days on a healthy domain. When that happens, impressions-to-clicks conversion jumps because position seven earns a meaningfully higher CTR than position fourteen.
To find these pages fast: in the Search Results report, filter by Position greater than ten and less than twenty-one. Export that list. That’s your growth queue — prioritize it by impressions volume, highest first.
Reading CTR as a Signal, Not Just a Metric
A low CTR on a high-impression keyword is a direct message from searchers: your title or description didn’t earn the click. That’s fixable. A high CTR on a low-impression keyword means you’ve got a great page that Google hasn’t fully trusted yet — that’s a different fix, usually authority and internal links.
Here’s how to separate the two problems:
- 🔹 High impressions, low CTR, position one through five: Your title tag is underperforming. Test a more specific, benefit-forward headline. Add a number or a year if the topic is evergreen.
- 🔹 High impressions, low CTR, position six through fifteen: You’re close. The page needs a content depth update and two to three strong internal links from higher-authority pages on your site.
- 🔹 Low impressions, high CTR: Google trusts this page with the people it shows it to, but it’s not showing it broadly. This is a topical authority signal — publish more content in this cluster.
- 🔹 Low impressions, low CTR: Deprioritize. These pages need a full audit before you invest more time in them.
This four-quadrant read turns your GSC data from a passive report into an active work queue. Every page on your site fits into one of those buckets. The ones in the first two are your fastest wins for Google Search Console traffic growth.
The Queries Tab Is Where the Real Answer Lives

Most site owners look at the Pages tab in GSC. The Queries tab is where the real answer to your traffic ceiling lives. This tab shows you every search phrase that triggered an impression for your site — including phrases you never intentionally targeted.
Filter the Queries tab by impressions, then scan for two things:
- Queries with high impressions but zero or near-zero clicks. These are keywords Google is testing your pages against. If you’re not ranking well enough to earn clicks, you either need a dedicated page for that query or a stronger content section within an existing page.
- Queries you didn’t know you ranked for. These are organic content gaps your site is already partially filling. A page about “how to start a blog” might be pulling impressions for “blog income timeline” — a query you never wrote about directly. That’s a signal to create a supporting piece that captures those impressions as clicks.
This is how a system compounds. You don’t just write content and hope. You read the data, find what Google is already trying to show your site for, and then build the page that earns those clicks. That’s the difference between a content calendar and a content system. If you want to understand how this fits into a broader traffic-building approach, the The Silent Webmaster blog covers the full framework across multiple posts.
Crawl Coverage: The Silent Traffic Killer
GSC’s Coverage report (now called Indexing in the updated interface) is the section most beginners ignore entirely. That’s a mistake. If Google can’t crawl and index your pages, your content doesn’t exist in search — period.
Check the Indexing report for these specific issues:
- 🚨 Discovered — currently not indexed: Google found the URL but chose not to index it. This usually means thin content, duplicate content, or a crawl budget problem on larger sites.
- 🚨 Crawled — currently not indexed: Google crawled it but still passed. This is a content quality signal. The page exists but Google doesn’t consider it worth serving to searchers.
- ✅ Submitted and indexed: These are your working pages. Track this number over time. A healthy content site should see this number grow steadily as you publish.
A common pattern on newer content sites: twenty pages published, twelve indexed, eight stuck in “Discovered — currently not indexed.” The fix is usually internal linking. Pages that sit in isolation with no internal links pointing to them are harder for Google to prioritize. Add two to three contextual internal links to any page that’s stuck, then request indexing again from the URL Inspection tool.
For a step-by-step walkthrough of building a site structure that makes indexing faster, the tutorials section on The Silent Webmaster walks through the technical setup in plain language.
Core Web Vitals: Your Speed Tax
GSC’s Core Web Vitals report shows you whether your pages pass Google’s performance thresholds — specifically Largest Contentful Paint, Interaction to Next Paint, and Cumulative Layout Shift. These aren’t abstract scores. They’re a direct input into how Google ranks your pages against competitors with similar content quality.
If your Core Web Vitals report shows a significant number of pages in the “Poor” or “Needs Improvement” category, you’re paying a speed tax on every ranking you’ve earned. A page that should sit at position four might be held at position seven because a faster competitor page exists. That difference costs you clicks every single day.
The fastest wins here are usually image optimization and eliminating render-blocking scripts. Tools like PageSpeed Insights (free, from Google) will show you the exact line items dragging your score down. Most WordPress sites can move from a poor score to a passing score by converting images to WebP format and switching to a lightweight theme or a performance-focused page builder.
How to Turn GSC Into a Weekly Growth Routine
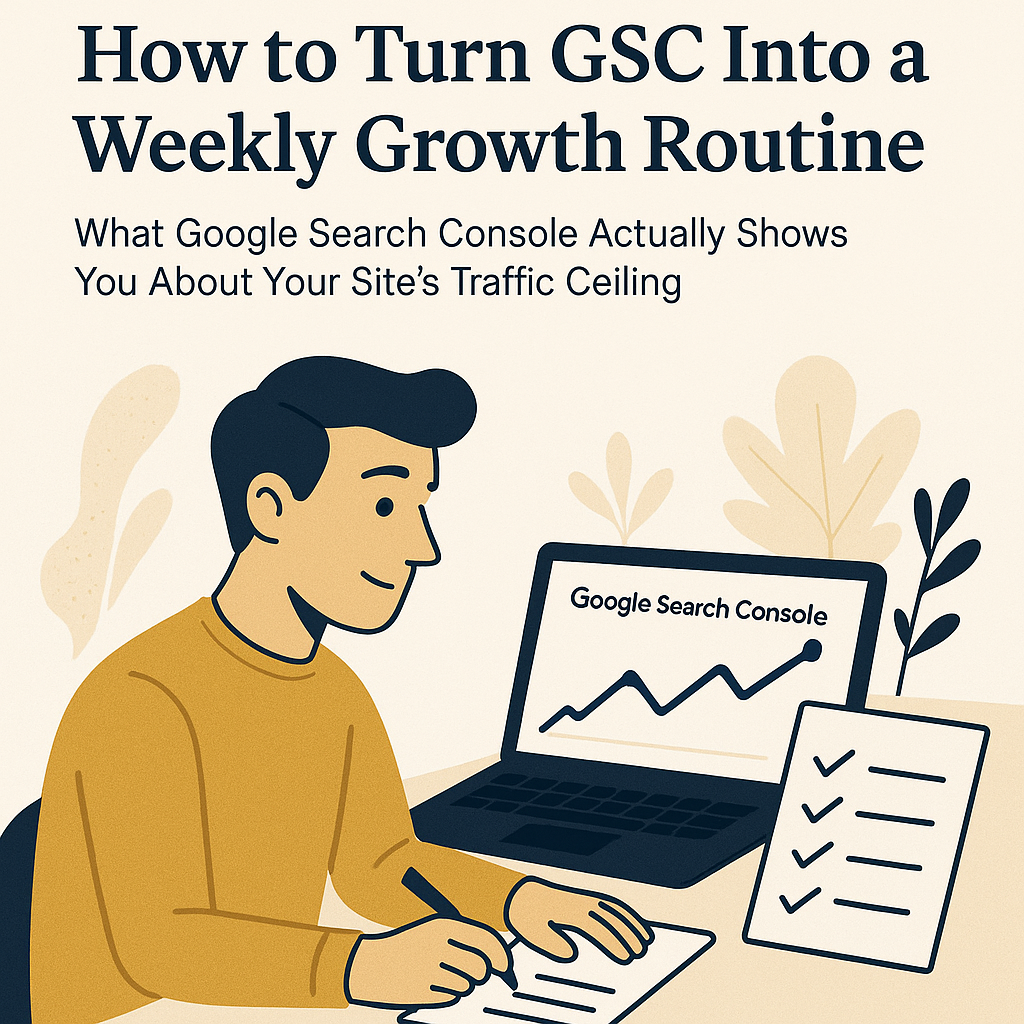
The site owners who grow consistently don’t check GSC once a month. They run a short weekly read that takes about fifteen minutes and produces a prioritized action list. Here’s the routine:
- Monday — Impressions check: Pull the last seven days versus the previous seven days. Look for pages where impressions dropped. A drop in impressions before a drop in clicks is an early warning signal — Google is testing your page less, which usually means a fresher or stronger competitor appeared.
- Monday — CTR quick wins: Filter for pages with more than five hundred impressions and a CTR below three percent. Pick one. Rewrite the title tag. Log the change and check it in two weeks.
- Weekly — Indexing check: Scan for any new “Discovered — currently not indexed” URLs. Add internal links to those pages immediately. Don’t let them sit.
- Monthly — Queries expansion: Pull the full queries list, filter for impressions over two hundred and clicks under ten. These are your next content pieces or your next content updates. Build a running list and work through it in order of impressions volume.
This is the operational layer of a traffic system. It’s not glamorous. But it’s the difference between a site that plateaus at three thousand monthly visitors and one that compounds to thirty thousand over eighteen months. The episodes archive on The Silent Webmaster has real walkthroughs of this process applied to actual sites if you want to see the mechanics in action.
The Bottom Line on Your Traffic Ceiling
Your traffic ceiling is not set by your niche, your domain age, or how many articles you’ve published. It’s set by how well you read and respond to the data Google is already handing you for free. GSC shows you the impressions you’re earning but not converting, the keywords you’re ranking for but not targeting, the pages Google found but won’t index, and the speed problems costing you positions you already earned.
Every one of those data points is a crack in the ceiling. Work the cracks systematically — title tags, internal links, content depth, indexing fixes, Core Web Vitals — and the ceiling moves up. Not because you got lucky, but because you built a system that reads the receipts and responds to them.
Start with the impressions report this week. Pull your page-two keywords. Pick the top three by impressions volume. Update those pages. That’s your first move. The data will show you the next one.
If you want a structured path for building the kind of content site that uses this data as fuel, start with the resources page — it’s where the tools and frameworks are laid out without the fluff.
Leave a Reply